
April 23, 2024 | Kevin Saem, Ph.D. |
MedTech Industry Report
In 2023 the MedTech vertical experienced a period of cash flow freeze. According to our 2023 annual financial report, we logged a total of $17.95 billion of investment into MedTech companies which excluded financial numbers from revenue. We wanted to provide the MedTech community with the lowest point measurement on the health of the market so that the data presented is actionable for leaders to make key strategic decisions. Every dollar reported can be traced back to the exact date, companies and events in Zapyrus.
*Zapyrus users will be able to access the exact companies and contacts using the key links below. Look out for the lightning bolt emoji (⚡) as an indicator.
Questions that are answered in this report
[1] What is the overall health of the MedTech vertical in Q1 2024 compared to 2023 in reference to the financial investment?
1.1 What can we predict from the M&A volume?
1.2 How does funding impact clinical activity in Q1 2024?
[2] How is the Q1 2024 funding being distributed?
2.1 Funding distribution by medical technology segment
2.2 Funding distribution by therapeutic area
[3] How can MedTech service providers learn from 2023 and use this Q1 2024 data to ensure that they are meeting growth targets for 2024?
[1] What is the overall health of the MedTech vertical in Q1 2024 compared to 2023 in reference to the financial investment?
Financially, the funding climate in MedTech has increased by a significant amount in 2024 to date. In 2023, the entire year funding total was captured in our annual MedTech funding report and equated to $17.95 billion dollars of investments. The shocking low funding total was the result of the COVID-19 pandemic surge of funding in the peak pandemic years of 2021 - 2022 followed by the drastic dip in the following 2023 year, known as the “COVID Cliff”. This total made up approximately 11% of the MedTech market in reference to the number of MedTech companies.
In contrast to last year, Q1 2024 alone saw a total of $11.04 billion dollars worth of investments received by MedTech companies around the globe excluding revenue dollars. The numbers suggest that the market is picking back up in a big way. However, looking at the M&A volume and clinical pipeline numbers between Q1 2023 and Q1 2024, we can have a more accurate look at how funding is a lagging indicator to how a market will perform in the current year.
⚡ Zapyrus users can gain access to all of these MedTech companies by clicking here.
[1.1] What can we predict from the M&A volume?
Figure 1 below shows a year-over-year increase from Q1 2023 to Q1 2024 in mergers and acquisitions (M&A) by company volume of 36%. This increase correlates well with the significant increase in funding this year to date. A healthy M&A trend in MedTech is a great sign that the cash withheld from 2023 are being re-injected into the market and fueling the commercial market activity.
This increase in MedTech M&A activity is great news for service providers that operate in the commercial stages of the market in the short term like market research firms, commercial strategy firms, commercial data providers, commercial scale contract manufacturing services, and enterprise eQMS providers.
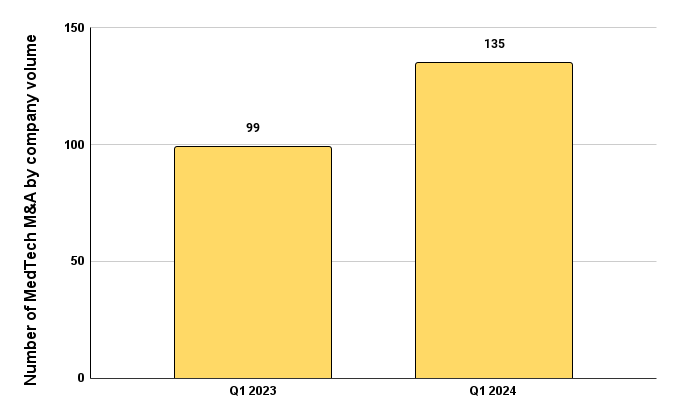
Figure 1. The number of mergers and acquisitions (M&A) that occurred by company volume comparing Q1 2023 and Q1 2024.
⚡ Zapyrus users can gain access to all Q1 2024 Medtech M&A activity by clicking here.
[1.2] How does funding impact clinical activity in Q1 2024?
Contrary to popular belief, current year funding data is a lagging indicator for current year market health. The funding data of the previous year will be a better predictor of the first half of market activity in the current year. Q1 2024 clinical pipeline is negatively impacted by the reduced financial investments into MedTech from calendar year 2023. If you are confused, then that’s good because this statement defies your logical brain.
Let’s take a moment to pause for a second to think about it. Businesses mitigate risk by planning out their spending with cash on hand and not future projected investments. Therefore, the clinical activity seen in Q1 2023 reflects the plans and financial investments from 2022. Similarly, Q1 2024 clinical activity reflects the financial investments from 2023. Since 2023 saw a dip in financial activity, we should expect that clinical activity in Q1 2024 will be reduced compared to Q1 2023.
Figure 2 below shows exactly this trend. From across the board, we see that from future planned clinical trials all the way to product approval in Q1 2024 has decreased in volume compared to Q1 2023.
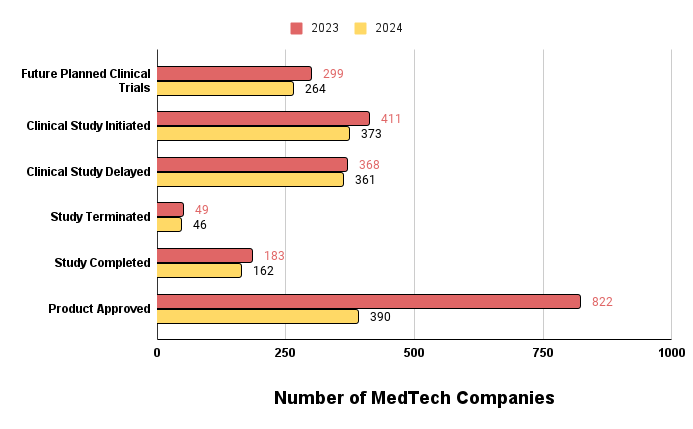
Figure 2. Clinical pipeline volume between Q1 2023 and Q2 2024.
⚡ Zapyrus users can gain access to all Q1 2024 Medtech clinical activity by clicking here.
The large variance between medical technology product approval from Q1 2023 and Q1 2024 is due to the increased investments and accelerated approval programs during the 2021-2022 pandemic years. Additionally, product approval is a lagging indicator of the clinical investment pipeline as most medical technologies that enter clinical trials do not make it to regulatory approval. The high volume of approved medical technologies from 2023 coupled with increased financial investments into commercial stage companies should make for a great recipe for service providers offering services at the commercial stage.
Interestingly enough, there is a real opportunity for clinical services and CROs to help MedTech companies reduce the timeline of clinical studies and ensure that the clinical trials reach completion. The number of delayed clinical trials are almost 400 in Q1 this year alone with 46 clinical studies terminated. It’s clear that the large variation in funding from 2023 and 2024 does not correlate to the relatively similar numbers in clinical studies being delayed or terminated. This data suggests that the delayed or terminated trials are not caused by the lack or abundance in funding but rather speaks more to the management/execution of the clinical trial or the science itself.
Although the data suggests that there is very little correlation between clinical trial success and funding volume, it will be interesting to look at how the funding is being distributed in Q1 2024 to help better predict how service providers in MedTech can pivot to meet the demands of MedTech companies.
[2] How is the Q1 2024 funding being distributed?
Knowing the total amount of funding is only the beginning of predicting growth in the MedTech market. Having a deeper understanding of where the funding is being distributed will help you make the right business decisions to focus your specialty services towards the market demands. Figures 3,4,and 5 summarizes the funding distribution by employee range, geographical location, and company maturity respectively.
We can divide funding into three buckets, below $1 billion, $1-2 Billion, and above $2 billion. Figure 3 shows us that companies that are early stage startups of less than 10 employees in size received about $400 million in funding. This makes sense given that companies that this size are looking to put together regulatory/reimbursement strategy, proof of concept lab scale models, and small animal testing. Companies at this size require less capital expenditure.
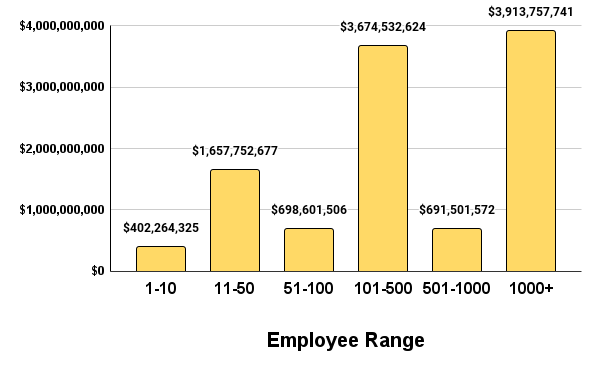 Figure 3. Q1 2024 funding in USD distributed by employee size ranges.
When we move onto companies between 11-100 employees we see a relative spike in funding totals towards approximately $2.3 billion. The close to 6x increase in financial investment is attributed to the needs of companies at this size to progress through more expensive design & development work, large animal studies, first-in-human, and successive feasibility and pivotal studies. From here we see a further increase in investment dollars between companies that have 101-1000 employees towards approximately $4.3 billion. Once again this jump signifies larger capital demands to complete late stage pivotal studies, manufacturing small batches, preparing for product approval and commercial launches. Lastly we see a slight dip back down for companies that have more than 1000+ employees. This is due to the fact that they either get acquired, merged, or are revenue generating and therefore require less financial investments from venture capital firms and private equity firms.
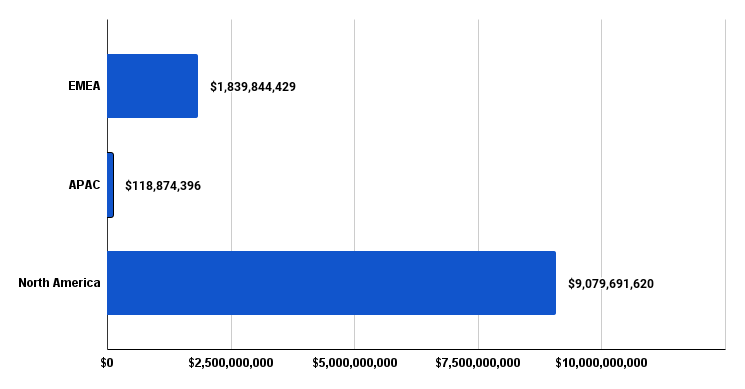 Figure 4. Q1 2024 funding in USD distributed by geographical region. EMEA (Europe, Middle-East, Africa), Asia-Pacific (APAC), and North America (NA).
Figure 4 above highlights the concentration of funding by major global regions. We see that the majority of funding is coming from MedTech companies that are headquartered in North America making up more than $9 billion dollars in funding. EMEA MedTech funding activity sits lower than $2.5 billion dollars and it may be explained by the regulatory changes to the MDR
and IVDR where current MedTech companies are scrambling to obtain updated approval status to keep their medical technologies in the market while upcoming MedTech companies are prioritizing the North American market for their initial product launch and returning to the EU at a later point in time. Given that the funding distribution sits quite heavily in North America, the following data discussed will have greater relevancy and focus on the North American MedTech market.
When we look at funding distribution by the stage of the MedTech company, we can see that 68% of the total $11.04 billion in funding is used to support commercial stage companies where only 32% of that total is supporting pre-commercial stage activities. This distribution is important if you are a service provider because it will allow you to better predict the challenges ahead if you are competing in the pre-commercial segment of the market and are seeking growth this year.
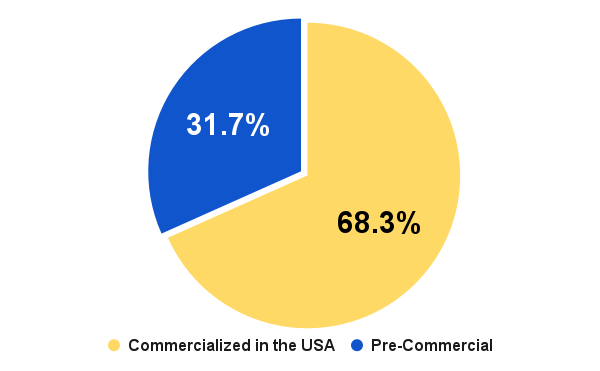
Figure 5. Q1 2024 funding distribution by company development stage.
If growth is top of mind, then you need to know exactly which companies are entering 2024 with funding. Additionally, it’s important to know which MedTech companies are currently receiving funding at the stage in which they are a fit for your services. This is especially true if you operate in the pre-commercial stages and have no plan on accurately targeting your prospects. The numbers from Figure 5 above show that you have a higher chance to miss your target prospective client than you are at getting to the right ones.
[2.1] Funding distribution by medical technology segment
Out of all of the total MedTech funding in Q1 2024, the medical technology segment that received the most was medical devices at 71.8%. This majority distribution of funds into medical devices makes sense because medical devices contain the most diverse set of technologies and applications. Additionally, most high risk class 3 technologies tend to be medical devices and thus demand a larger amount of capital to reach market maturity.
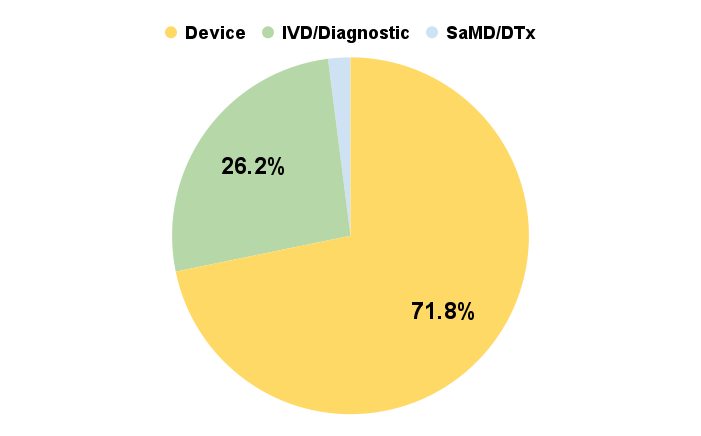 Figure 6. Funding distribution by medical technology type. Device 71.8%, IVD/Diagnostic 26.2%, and SaMD/DTx 2%.
IVD/Diagnostic technologies make up 26.2% of the funding in Q1 2024. This amount of funding is representative of the ratio of investment in years prior to the COVID-19 pandemic. IVD/Diagnostic technologies tend to be lower risk, less complex and therefore less expensive to bring to market. The ratio of funding to support the growth of this type of medical technology reflects this lower cost segment. Lastly, the emerging and newer SaMD/DTx segment make up the remaining 2% of the total funding in Q1 2024. The 2% of funding equates to roughly a quarter of a billion dollars from 53 SaMD/DTx companies.
[2.2] Funding distribution by therapeutic area and segment
Most service providers look at therapeutic areas as a way to segment their serviceable market in MedTech. Clinical services like MedTech CROs lean heavily on this because they typically start off by specializing in a handful of key therapeutic areas where they can win business in. Segmenting the market this way allows businesses to quickly capture market share within an industry niche and rely on their internal expertise to serve the right type of client.
Figure 7 below shows a consistent trend between the leading therapeutic area of investment from 2023 to Q1 2024 in Neurology at 18%. Close second and third are Women’s Health at 14% (which historically was under represented) and Cardiovascular at 13%. A close fourth is Gastroenterology and Urology at 12%. The rest of the therapeutic areas are roughly evenly funded ranging from 5% to 9%.
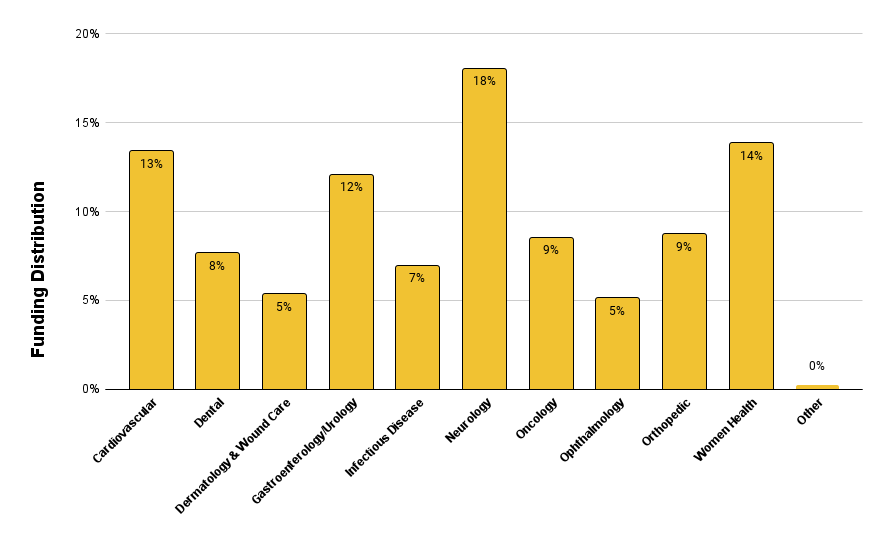
Figure 7. Funding distribution by medical therapeutic area.
It’s important that we not only look at the binary relationship between funding and therapeutic area but rather apply this relationship in the context of technology type. From Figure 6 above, we know that medical devices represent the majority of funding in Q1 2024. We can see from Figure 8 below that within the medical device segment, the therapeutic areas that are the most prominent reflect the overall funding by therapeutic area plot from above in Figure 7.
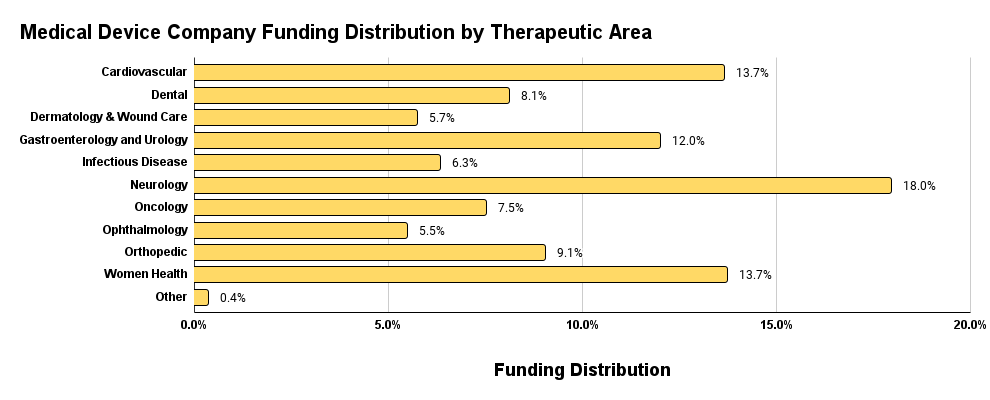
Figure 8. Medical device funding distribution by therapeutic area.
When we look at adjacent therapeutic areas in medical devices, we see that they also roughly correlate to the overall funding distribution by therapeutic area. This is expected given that medical devices make up 71.8% of the funding investments in Q1 2024 and therefore would contribute the most to trends in the overall funding distribution by therapeutic area.
The correlation with the overall funding by therapeutic area stops when we look at the IVD/Diagnostic funding distribution by therapeutic area plot below in Figure 9. The funding distribution in IVD/Diagnostic is relatively evenly distributed with the peak and trough variance of only 3.4%. Leading the charge are Oncology, Ophthalmology, and Women’s Health.
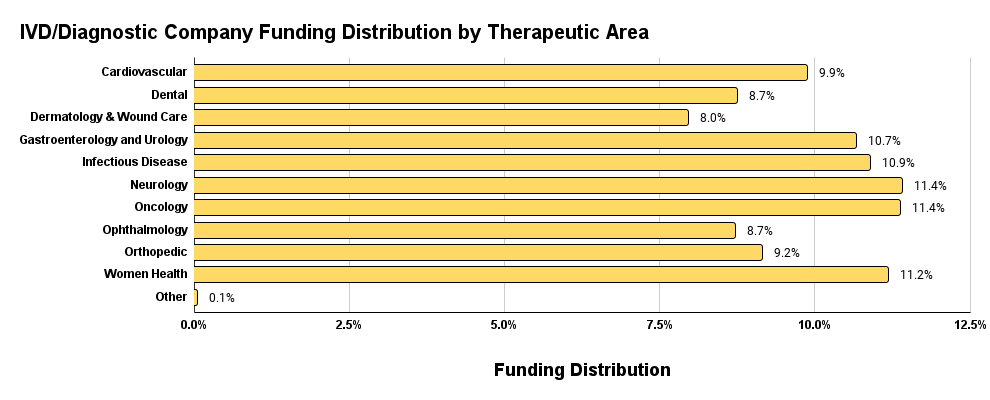
Figure 9. IVD & Diagnostic funding distribution by therapeutic area.
Conversely, when we look at the SaMD funding distribution by therapeutic area below in Figure 10, we notice a significant outlier with the Neurology therapeutic area leading the charge with 25.5% of SaMD investments in Q1 2024. This suggests that the health applications of SaMD are most prevalent within neurological disease applications. Women’s Health funding in SaMD comes in second with Dental coming in a close third. This funding distribution in SaMD makes sense given the rise in artificial intelligence (AI), large language models (LLM), and mental health awareness. Neurology is an immediate fit for SaMD as an ideal therapeutic area of choice given the direct health applications.
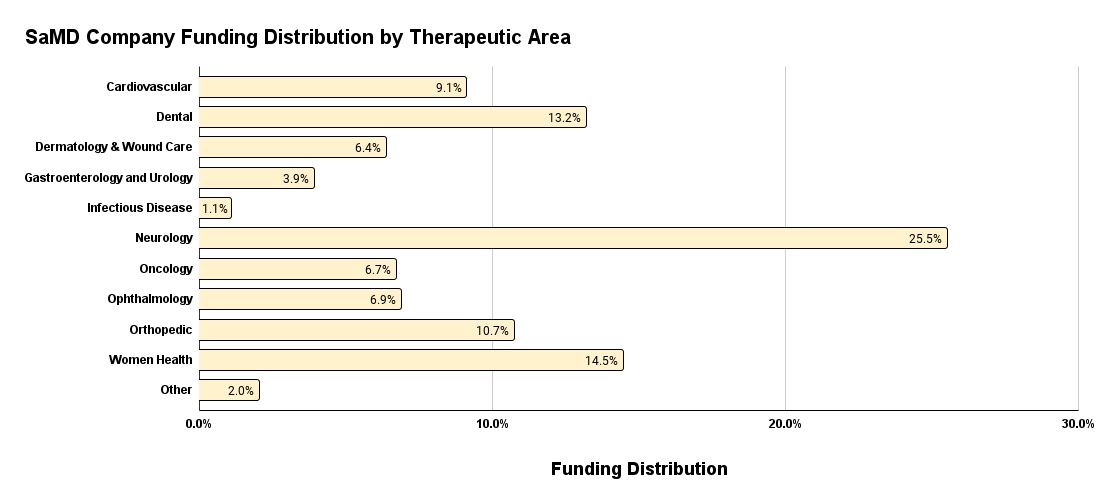
Figure 10. SaMD funding distribution by therapeutic area.
Overall, each medical technology subsegment reflects the funding distribution ratio in line with the application of these technologies in their respective unmet medical conditions. As we start to see more regulatory approval for novel SaMD/DTx technologies along with more standardized regulation, we may begin to see other therapeutic areas gain market share.
[3] How can MedTech service providers learn from 2023 and use this Q1 2024 data to ensure that they are meeting growth targets for 2024?
The secret to 2024 success is in understanding how the funding and clinical pipeline from 2023 translate to Q2 2024 pre-commercial opportunities along with how Q1 2024 funding can inform Q2 2024 commercial opportunities. As MedTech service providers, it’s important to stay one step ahead of MedTech companies that are approaching the right time for your services. Therefore, Zapyrus future plans enabled by machine learning can transform the way you leverage data in an actionable way.
In Q1 2024 alone, there are 264 MedTech companies looking to conduct a future clinical trial in the following quarters. 129 MedTech companies are looking to submit for regulatory approval and 25 companies are actively seeking design and development help. Lastly, 206 MedTech companies are looking to commercialize their product in the upcoming quarters.
These types of triggers not only take you beyond funding, but allow you to better time your business development efforts towards prospective clients that are more likely to convert.
Conclusion
The landscape of MedTech funding in 2024 demonstrates a resurgence from the previous year's decline, indicating a promising trajectory for the industry. The substantial increase in investment, coupled with a surge in M&A activity, signifies renewed confidence and vitality. However, the correlation between funding and clinical activity underscores the importance of a nuanced understanding of market dynamics.
While funding levels serve as an essential metric, they are only part of the equation. Clinical pipeline trends reveal deeper insights into market health, reflecting past investments and guiding future expectations. Moreover, the distribution of funding across different company sizes, regions, and developmental stages highlights evolving market preferences and opportunities.
For service providers in the MedTech sector, leveraging insights from both funding data and clinical pipelines is crucial for strategic growth. By aligning business strategies with the evolving needs of MedTech companies, service providers can capitalize on emerging opportunities and drive sustainable success in 2024 and beyond.
Thank you for reading this report and we wish you all the best in 2024!
Subscribe to “the BUZZ” to be updated on the MedTech industry trends, sales best practices, upcoming conferences/events in MedTech, interviews with founders and more.
Tell us what you think and what you’d like to see from us next!


